将 Gnuplot 与 Python 结合使用
Gnuplot 是一个开源命令行驱动的交互式数据绘图软件。 如果您是 Gnuplot 用户并且想在 Python 中使用它,那么您可以借助两个包 Gnuplot 和 PyGnuplot 轻松地做到这一点。
我们也可以使用 Matplotlib 在 Python 中绘图,但它不如 Gnuplot 高效。 另一方面,Gnuplot 是一个 2D 和 3D 绘图实用程序,性能良好并且比 Matplotlib 快得多。
将 Gnuplot 与 Gnuplot.py 一起使用
Michael Haggerty 开发了 Gnuplot.py 包。 此软件包的先决条件如下。
- 安装 Gnuplot 软件。
- 安装 Python(从 2.2 到 3 的任何版本)。
- 借助 pip 在 Python 中安装 NumPy 包。
要在 Python 中安装 Gnuplot 包,我们必须在 Windows 中执行以下步骤:
- 从 Gnuplot.py 下载 Gnuplot.py 包。
- 打开命令提示符。
- 移至命令提示符中的 Gnuplot.py 位置。
-
输入此命令:
python setup.py install
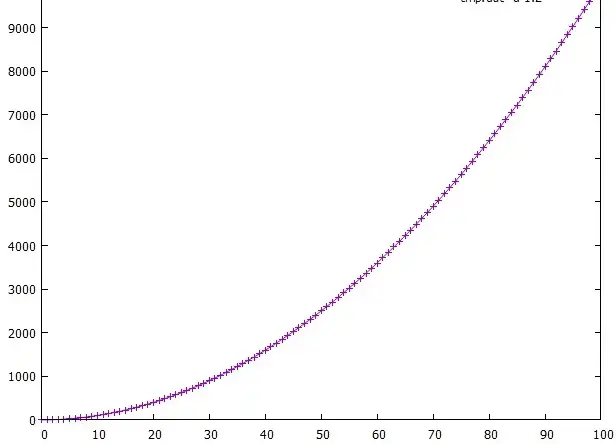
当您安装 Gnuplot.py 包 numpy 时,您可以使用此代码访问 Gnuplot 软件。
# import libraries
import numpy as np
import Gnuplot

# assign x range 0 to 100
x = np.arange(100)

# assign y range of x square
y = x**2

#load Gnuplot software
g = Gnuplot.Gnuplot()
d = Gnuplot.Data(x,y,with_='lp')

#plot line point on the base of x and y
g.plot(d)
输出:
将 Gnuplot 与 pyGnuplot 一起使用
Gnuplot 现在已经不支持了,所以我们可以通过导入 pyGnuplot 包来在 Python 中使用 Gnuplot,pyGnuplot 包是 Python 最新版本的内置包。 它是 Gnuplot 软件的包装器。
我们必须在 Windows 中按照以下步骤在 Python 中安装 pyGnuplot 包。
- 移动到 python.exe 位置。
- 按 shift 键并右键单击给定位置。
- 从弹出菜单中选择打开 powershell 窗口。
-
使用 pip 安装 PyGnuplot。 输入此命令:
安装成功后,我们就可以使用它了。pip install PyGnuplot
现在,让我们看几个 PyGnuplot 包的例子。
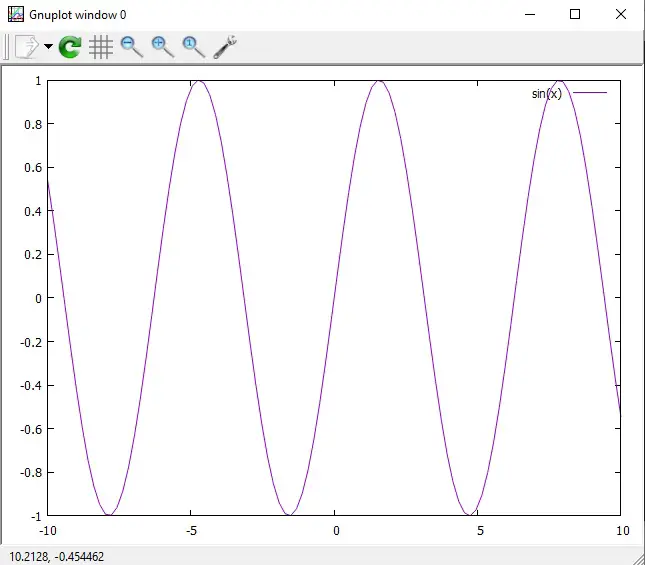
sin(x) 的示例代码:
from PyGnuplot import gp

# Write path of your gnuplot.exe
fig1 = gp(r'C:\Program Files\gnuplot\bin\gnuplot.exe')

#a stand for ask gnuplot; it send command to gnuplot
fig1.a("plot sin(x)")
输出:
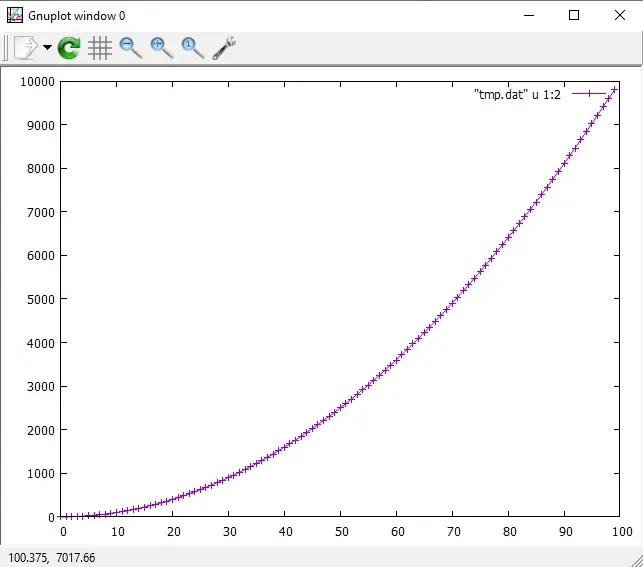
使用 Gnuplot 的默认数据文件:
#same example Written for Gnuplot.py

#import libraries
from PyGnuplot import gp
import numpy as np

# x range till 100
x = np.arange(100)

#y is equal to the square of x
y = x**2

# Write the path of your gnuplot.exe
fig1 = gp(r'C:\Program Files\gnuplot\bin\gnuplot.exe')

#by default, save tmp.dat data file
fig1.save([x,y])

#give the command to gnuplot to plot the data file using columns 1 and 2 to draw line points
fig1.c('plot "tmp.dat" u 1:2 w lp')
输出:
我们可以使用 pdf() 方法将图形保存为 PDF 格式。
fig1.pdf('figure.pdf') # outputs pdf file
我们可以使用 fit 和 fit2d 函数来快速适应 Gnuplot。 我们可以使用 ps 函数将 Gnuplot 打印成后记。
我们可以在 PyGnuplot 的文档中看到许多其他方法。
总结
Gnuplot 在性能上比 Matplotlib 好很多,作为 Gnuplot 用户,你不需要转向 Matplotlib。 当你是Gnuplot软件的专家时,你不需要学习新的术语,所以我们可以很容易地使用Python中的Gnuplot.py和PyGnuplot包来实现Gnuplot软件。
相关文章
Pandas DataFrame DataFrame.shift() 函数
发布时间:2024/04/24 浏览次数:133 分类:Python
-
DataFrame.shift() 函数是将 DataFrame 的索引按指定的周期数进行移位。
Python pandas.pivot_table() 函数
发布时间:2024/04/24 浏览次数:82 分类:Python
-
Python Pandas pivot_table()函数通过对数据进行汇总,避免了数据的重复。
Pandas read_csv()函数
发布时间:2024/04/24 浏览次数:254 分类:Python
-
Pandas read_csv()函数将指定的逗号分隔值(csv)文件读取到 DataFrame 中。
Pandas 多列合并
发布时间:2024/04/24 浏览次数:628 分类:Python
-
本教程介绍了如何在 Pandas 中使用 DataFrame.merge()方法合并两个 DataFrames。
Pandas loc vs iloc
发布时间:2024/04/24 浏览次数:837 分类:Python
-
本教程介绍了如何使用 Python 中的 loc 和 iloc 从 Pandas DataFrame 中过滤数据。
在 Python 中将 Pandas 系列的日期时间转换为字符串
发布时间:2024/04/24 浏览次数:894 分类:Python
-
了解如何在 Python 中将 Pandas 系列日期时间转换为字符串

