如何在 Matplotlib 中一个图中正确显示多个图像
在图形中显示多个图像的核心思想是遍历轴列表以绘制单个图像。我们使用 imshow()方法显示单个图像。
在 for 循环中使用 Matplotlib add_subplot()
在一个图中显示多个图像的最简单方法可能是使用 add_subplot() 启动子图并使用 imshow() 方法显示每个图像,并在 for 循环中显示图像。
add_subplot() 方法的语法:
add_subplot(rows, columns, i)
其中 rows 和 columns 代表合成图中行和列的总数,i 代表要显示的图像的索引。
import numpy as np
import matplotlib.pyplot as plt

width=5
height=5
rows = 2
cols = 2
axes=[]
fig=plt.figure()

for a in range(rows*cols):
    b = np.random.randint(7, size=(height,width))
    axes.append( fig.add_subplot(rows, cols, a+1) )
    subplot_title=("Subplot"+str(a))
    axes[-1].set_title(subplot_title)
    plt.imshow(b)
fig.tight_layout()
plt.show()
输出:

我们可以在上面的代码中增加更多的灵活性,以在选定的轴上绘制更多特征,并提供对子图的每个轴的访问。
import numpy as np
import matplotlib.pyplot as plt

width=5
height=5
rows = 2
cols = 2
fig=plt.figure()

x=np.linspace(-3,3,100)
y1=np.sin(x)
y2=1/(1+np.exp(-x))

axes = []

for i in range(cols*rows):
    b = np.random.randint(10, size=(height,width))
    axes.append( fig.add_subplot(rows, cols, i+1) )
    subplot_title=("Subplot"+str(i))
    axes[-1].set_title(subplot_title)
    plt.imshow(b)

axes[1].plot(x, y1)
axes[3].plot(x,y2)
fig.tight_layout()

plt.show()
输出:
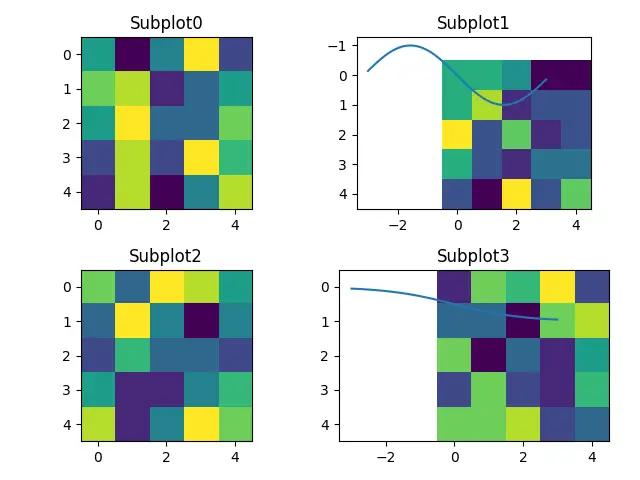
在这里,axes 允许访问操作每个子图。
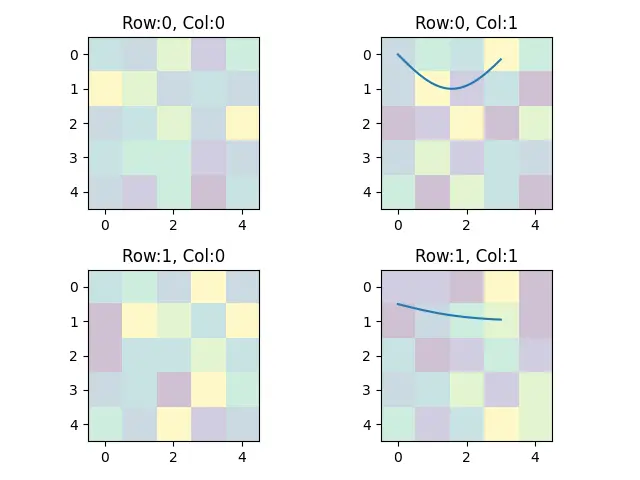
另外,我们还可以通过 [row_index][column_index] 提供对每个子图的访问权限,当我们具有多个图像数组时,这将更为有用。
import numpy as np
import matplotlib.pyplot as plt

width=5
height=5
rows = 2
cols = 2

x=np.linspace(0,3,100)
y1=np.sin(x)
y2=1/(1+np.exp(-x))

figure, axes = plt.subplots(nrows=rows, ncols=cols)

for a, b in enumerate(axes.flat):
    image = np.random.randint(7, size=(height,width))
    b.imshow(image, alpha=0.25)
    r = a // cols
    c = a % cols
    subtitle="Row:"+str(r)+", Col:"+str(c)
    b.set_title(subtitle)

axes[0][1].plot(x, y1)
axes[1][1].plot(x,y2)

figure.tight_layout()
plt.show()
输出:
根据 Matplotlib 中子图定义功能
我们可以基于 subplots 命令定义一个函数,该命令会在图中创建许多轴。根据行和列的数量,然后在轴列表上进行迭代以绘制图像,并为每个图像添加标题。
import numpy as np
import matplotlib.pyplot as plt

def display_multiple_img(images, rows = 1, cols=1):
    figure, ax = plt.subplots(nrows=rows,ncols=cols )
    for ind,title in enumerate(images):
        ax.ravel()[ind].imshow(images[title])
        ax.ravel()[ind].set_title(title)
        ax.ravel()[ind].set_axis_off()
    plt.tight_layout()
    plt.show()

total_images = 4
images = {'Image'+str(i): np.random.rand(100, 100) for i in range(total_images)}

display_multiple_img(images, 2, 2)
输出:

相关文章
Pandas DataFrame DataFrame.shift() 函数
发布时间:2024/04/24 浏览次数:133 分类:Python
-
DataFrame.shift() 函数是将 DataFrame 的索引按指定的周期数进行移位。
Python pandas.pivot_table() 函数
发布时间:2024/04/24 浏览次数:82 分类:Python
-
Python Pandas pivot_table()函数通过对数据进行汇总,避免了数据的重复。
Pandas read_csv()函数
发布时间:2024/04/24 浏览次数:254 分类:Python
-
Pandas read_csv()函数将指定的逗号分隔值(csv)文件读取到 DataFrame 中。
Pandas 多列合并
发布时间:2024/04/24 浏览次数:628 分类:Python
-
本教程介绍了如何在 Pandas 中使用 DataFrame.merge()方法合并两个 DataFrames。
Pandas loc vs iloc
发布时间:2024/04/24 浏览次数:837 分类:Python
-
本教程介绍了如何使用 Python 中的 loc 和 iloc 从 Pandas DataFrame 中过滤数据。
在 Python 中将 Pandas 系列的日期时间转换为字符串
发布时间:2024/04/24 浏览次数:894 分类:Python
-
了解如何在 Python 中将 Pandas 系列日期时间转换为字符串

