Changing the Properties of Graphics in MATLAB
We will study different ways to change the size, resolution, and background color of the desired figure in MATLAB. We will use different sample codes and relevant output to clear your concepts and give you a comprehensive understanding of the ways to set the figure size, resolution, background color or graphics in MATLAB.
The easiest way is to use exportgraphicsthe function provided by MATLAB. We can use exportgraphicsthe tool to export charts in documents/publications, such as articles or PowerPoint slides.
We can use this method to save the graphics with correct size, quality and background color as per any requirement.
As we all know, the picture is made up of pixels, and cropping emphasizes the reduction of pixels resulting in information loss. exportgraphicsWhen using the function, the stored data will be tightly cropped along the x-axis and y-axis with the screen background.
What is stored does not include all UI elements and adjacent objects, such as our drawing panel.
Use exportgraphicsthe function to change the size of an image or graphic
exportgraphicsFunction records the material at the same width and height as it is displayed on the screen. If you modify the width and height, change the size of the content in the figure.
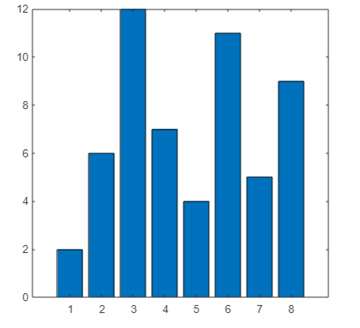
One method generates the plot in a tiled chart style with no padding at the desired size. The layout is then sent to exportgraphicsthe method. For example, to save a bar chart as a 3 x 3 inch square picture, create a tiled plot and set our Paddingoption to tight.
op = tiledlayout(1,1,'Padding','tight');
op.Units = 'inches';
op.OuterPosition = [0.31 0.31 4 4];
nexttile;
bar([2 6 12 7 4 11 5 9])
exportgraphics(op,'bar3x3.jpg','Resolution',299)
Output:

Use exportgraphicsthe function to change the resolution of an image or plot
As we all know, images by definition are stored in DPI (dots per inch). So, to export a plot at a specified resolution, we can use exportgraphicsthe function and declare it using name-value-pair statements.
Let us understand this concept by looking at the following example.
bar([2 6 12 7 4 11 5 9])
output = gcf;
exportgraphics(output,'barchart.png','Resolution',299)
Output:
We created a bar chart in this example and saved it with a 299-DPI-PNG file extension. Following this example, you can save any image or chart of your choice at the resolution you want.
Use exportgraphicsthe function to change the background color of an image or graphic
Let's exportgraphicsdo this by making a heatmap with a transparent background using the function.
op = heatmap(rand(12,12));
exportgraphics(op,'output.pdf','BackgroundColor','none','ContentType','vector')
Output:

For reprinting, please send an email to 1244347461@qq.com for approval. After obtaining the author's consent, kindly include the source as a link.
Related Articles
Commenting multiple lines in MATLAB
Publish Date:2025/04/18 Views:115 Category:MATLAB
-
This tutorial discusses how to comment multiple lines of code in MATLAB using the comment block method and the MATLAB Editor. Use comment blocks in MATLAB to comment multiple lines of code To comment one or two lines of code, we can % do it
Use mean() function in Matlab to get the average value of an array
Publish Date:2025/04/18 Views:145 Category:MATLAB
-
This tutorial will discuss finding the mean or average of an array using the function in MATLAB mean() . Use the MATLAB mean() function to find the average of an array To find the mean of an array, we can use Matlab's inbuilt function mean(
Find the index of a value in an array in Matlab
Publish Date:2025/04/18 Views:189 Category:MATLAB
-
This tutorial discusses find() finding the index of a value in an array using the function in MATLAB. Use the function in MATLAB find() to find the index of a value in an array In an array, elements are placed at certain indices starting fr
Sum of array elements in MATLAB
Publish Date:2025/04/18 Views:153 Category:MATLAB
-
This tutorial will discuss the use of function in Matlab sum() to find the sum of all the elements in an array. Use the MATLAB sum() function to get the sum of array elements. To get the sum of each element in an array, we can use the built
Plotting Slope Fields in MATLAB
Publish Date:2025/04/18 Views:196 Category:MATLAB
-
The ODE consists of equations involving functions and their derivatives 常微分方程 . We use 斜率 fields to illustrate the concept of our 微分 equations. We also call slope fields fields direction . Use the function in MATLAB slope_
Plotting the frequency distribution of data in MATLAB
Publish Date:2025/04/18 Views:140 Category:MATLAB
-
We will study different ways to plot frequency distribution curve of data in MATLAB. We will use different sample codes and relevant outputs to clear your concepts and provide you complete insights using MATLAB. Note that MATLAB allows user
Creating a new graph in Matlab
Publish Date:2025/04/18 Views:192 Category:MATLAB
-
In this tutorial, we will discuss how to figure() create a new graph using the function in MATLAB. figure() Create a new figure using the MATLAB function If you want to plot data on multiple graphs, you can use figure() the function to crea
MATLAB Maximize Graph
Publish Date:2025/04/18 Views:101 Category:MATLAB
-
In this tutorial, we will discuss how to use figure() the function in MATLAB to maximize a graph. figure() Maximize graphs using the function in MATLAB If you want to maximize a graph, you can use figure() the maximize function. To maximize
MATLAB sorts the rows
Publish Date:2025/04/18 Views:137 Category:MATLAB
-
This tutorial will discuss the use of the function in MATLAB sortrows() to sort the rows present in a matrix. In data analysis and processing, sorting is essential as it makes the data easy to analyze and process when it is sorted. For exam

