Plotting the frequency distribution of data in MATLAB
We will study different ways to plot frequency distribution curve of data in MATLAB. We will use different sample codes and relevant outputs to clear your concepts and provide you complete insights using MATLAB.
Note that MATLAB allows users to perform statistical operations using different functions such as histfit(), , hist()and sshist().
A frequency distribution is a list/table/graph that shows how often certain possibilities occur in our data set. We can use MATLAB to plot a frequency distribution curve for our data.
We can add data manually or import it from an Excel worksheet. Using different functions, we can easily get the desired curve.
We use the function in MATLAB sshist()to calculate the density estimate and obtain the frequency curve of our data.
To plot a frequency distribution graph in MATLAB, we first need to calculate the optimal number of bins for the histogram.
For our 核密度estimation calculations, we will assume that our frequency distribution has the standard bin length for histograms in MATLAB.
However, this approach is probably unrealistic. The first approach calculates the optimal bin width to produce the sharpest curve while preserving as much of the core PDF as possible.
The function sshistis not included in the list of standard functions of MATLAB, but we can obtain the source code of the function and use it to run our code to calculate the density estimate of bins. See the example,
Our_data = randn(1,1e4);

optN = sshist(Our_data);

figure(1)
[M,C] = hist(Our_data);
[Nop,Cop] = hist(Our_data,optN);
[f,xi] = ksdensity(Our_data,Cop);

dNom = mode(diff(Center));
dNom = mode(diff(Cop));

plot(Center,N/dNom,'.-',Cop,Nop/dNom,'.-',xi,f*length(Our_data),'.-')
legend('Default','Optimum','ksdensity')
title('Frequency Distribution')
Output:
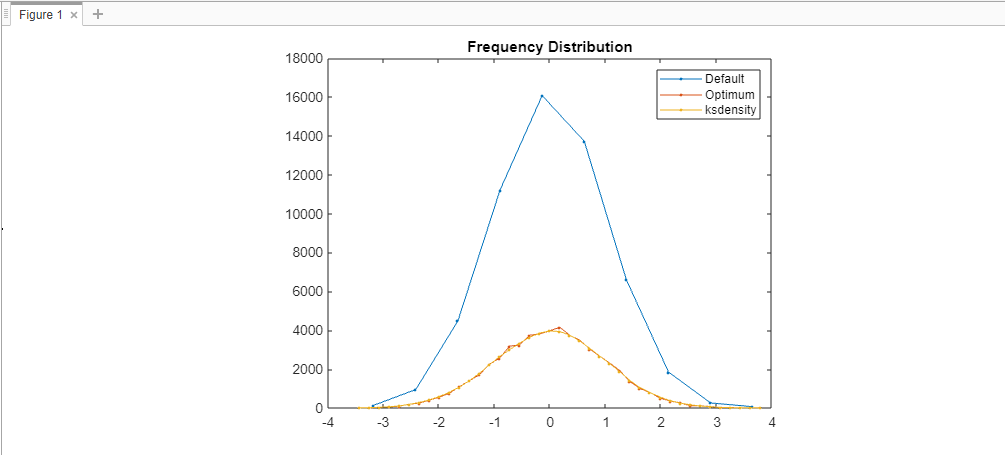
As mentioned above, we first calculate optimal-bin. The reason behind this calculation is to provide structure to our frequency distribution histogram.
When we use ksdensitythe function, it returns a flat curve. So, it depends on the nature of our work and the type of output graph we want based on our data.
Note that we used an additional m-file to successfully execute this code. The function sshist()is not predefined in MATLAB.
That's why we need to copy the source code of this function, create an m-file and paste the copied code here.
Then execute the code to get the frequency distribution graph.
In MATLAB we use histfit()the function to obtain the frequency curve of our data.
histfit()To construct a frequency distribution histogram with a normal distribution fit
using , let us take the data sample size to be 100, the variance to be 1, and the mean to be 10.
rng default;
freq_dist_data = normrnd(10,1,120,1);
histfit(freq_dist_data)
Output:
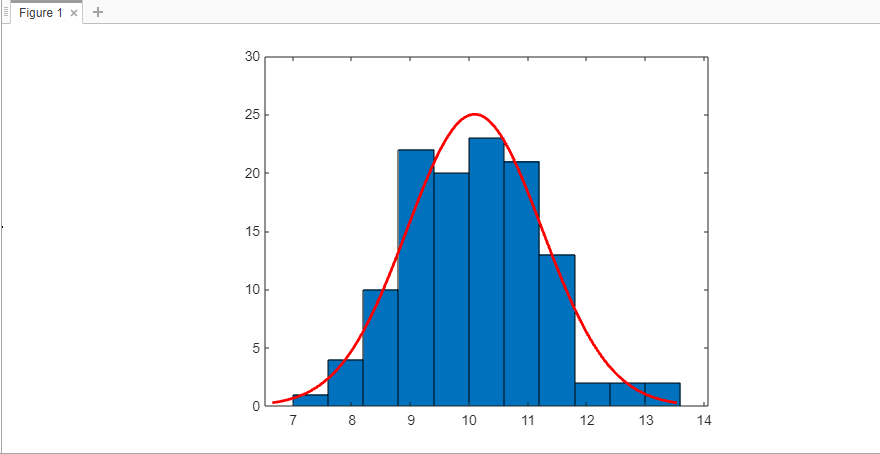
Note that histfitthe function in MATLAB fitdistworks similarly to the function to fit our frequency distribution to our dataset and return all the values used in the fit.
fitting_values = fitdist(freq_dist_data,'Normal')
Output:
fitting_values =

  NormalDistribution

  Normal distribution
       mu = 10.0894   [9.88181, 10.297]
    sigma =  1.1484   [1.01919, 1.31541]
For reprinting, please send an email to 1244347461@qq.com for approval. After obtaining the author's consent, kindly include the source as a link.
Related Articles
Commenting multiple lines in MATLAB
Publish Date:2025/04/18 Views:115 Category:MATLAB
-
This tutorial discusses how to comment multiple lines of code in MATLAB using the comment block method and the MATLAB Editor. Use comment blocks in MATLAB to comment multiple lines of code To comment one or two lines of code, we can % do it
Use mean() function in Matlab to get the average value of an array
Publish Date:2025/04/18 Views:145 Category:MATLAB
-
This tutorial will discuss finding the mean or average of an array using the function in MATLAB mean() . Use the MATLAB mean() function to find the average of an array To find the mean of an array, we can use Matlab's inbuilt function mean(
Find the index of a value in an array in Matlab
Publish Date:2025/04/18 Views:189 Category:MATLAB
-
This tutorial discusses find() finding the index of a value in an array using the function in MATLAB. Use the function in MATLAB find() to find the index of a value in an array In an array, elements are placed at certain indices starting fr
Sum of array elements in MATLAB
Publish Date:2025/04/18 Views:153 Category:MATLAB
-
This tutorial will discuss the use of function in Matlab sum() to find the sum of all the elements in an array. Use the MATLAB sum() function to get the sum of array elements. To get the sum of each element in an array, we can use the built
Plotting Slope Fields in MATLAB
Publish Date:2025/04/18 Views:196 Category:MATLAB
-
The ODE consists of equations involving functions and their derivatives 常微分方程 . We use 斜率 fields to illustrate the concept of our 微分 equations. We also call slope fields fields direction . Use the function in MATLAB slope_
MATLAB sorts the rows
Publish Date:2025/04/18 Views:137 Category:MATLAB
-
This tutorial will discuss the use of the function in MATLAB sortrows() to sort the rows present in a matrix. In data analysis and processing, sorting is essential as it makes the data easy to analyze and process when it is sorted. For exam
如何在 Matplotlib Pyplot 中显示网格
Publish Date:2024/02/04 Views:145 Category:Python
-
本文演示了如何在 Python Matplotlib 中在一个图上画一个网格。使用 grid()函数来绘制网格,并解释了如何改变网格颜色和线条类型。
在 Matplotlib 中的图中添加文字
Publish Date:2024/02/04 Views:181 Category:Python
-
本教程展示了我们如何使用 plt.text()方法在 Matplotlib 中为图或轴添加文字。
如何在 Matplotlib 中的多个线条之间进行填充
Publish Date:2024/02/04 Views:212 Category:Python
-
`fill_between()` 每次只能填充两条线之间的区域,但是我们可以选择一对行来填充多个线条之间的区域。

