Plotting Slope Fields in MATLAB
The ODE consists of equations involving functions and their derivatives 常微分方程.
We use 斜率fields to illustrate the concept of our 微分equations. We also call slopefields fields direction.
Use the function in MATLAB slope_field()to plot the slope field of a first-order general 微分equation
slope_field()Functions take three parameters. The first parameter is fthe function we are dealing with 带有 x 和 y 参数的方程.
The second parameter is the minimum and maximum limits that our xparameter lies within. The third parameter is the minimum and maximum limits that our yparameter lies within.
These limits are often called xthe and ydomains. The function slope_field()helps us plot the slope field of our equation, while returning a graphics handle for our field.
Assume that our difference equation is:
$$
\frac {dy} {dx} = \frac {3y} {1-2x}
$$
We set the domain of x to be [-1,12]and the domain of y to be [-4, 5].
This means that our function f(x,y) = 3y/(1-2x)is
f = @(x,y) 3*y/(1-2*x);
figure;
slope_field(f,[-1,12],[-4,5]);
xlabel('$x$','interpreter','latex','fontsize',17);
ylabel('$y$','interpreter','latex','fontsize',17);
title('Slope Field for $\displaystyle\frac{dy}{dx}=\frac{3y}{1-2x}$',...
    'interpreter','latex','fontsize',17);
Output:
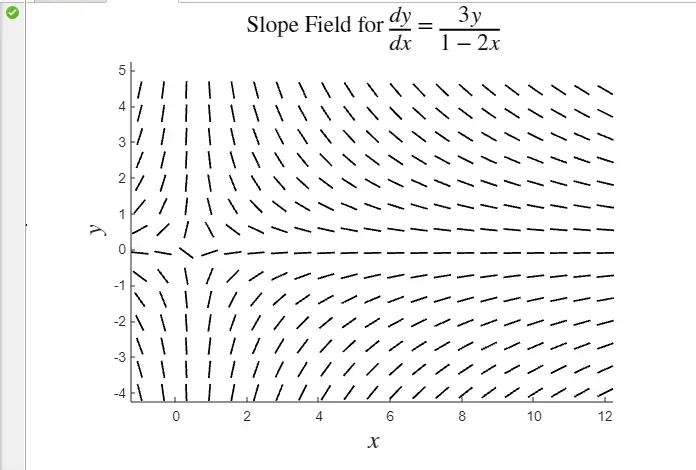
In this example, we used slope_field()the function with the default settings and visualized 微分the slope field for the equation we wanted.
Use the function in MATLAB quiver()to plot the slope field of a first-order general 微分equation
The function quiver()takes four parameters:
- X coordinate
- Y coordinate
- The directional component of the X coordinate represented by U.
- The directional component of the Y coordinate represented by V.
This function returns a graphical representation of the slope field in the form of arrows with coordinates X 和 Yand direction components U 和 V.
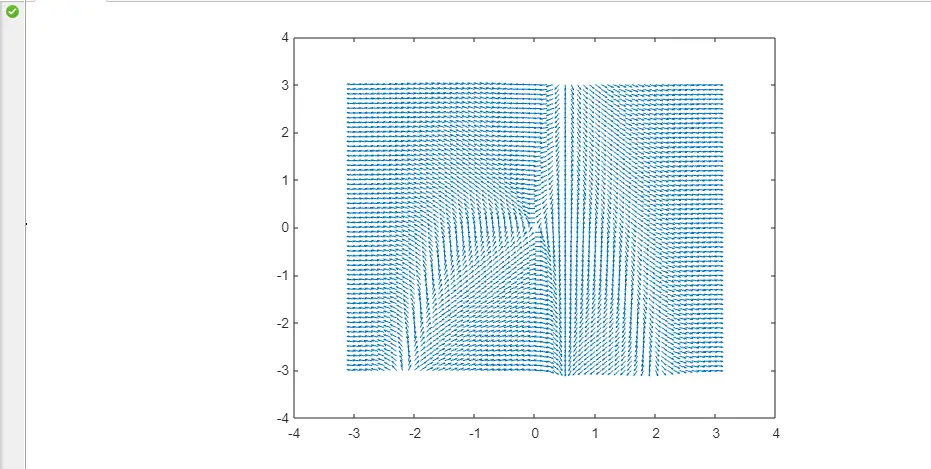
Assume that our differential equation is:
$$
\frac {dx} {dt} = x^5+6xy-3y
$$
$$
\frac {dy} {dt} = -8x+sin\left(2yx\right)
$$
[x,y] = meshgrid(-3:0.1:3);
dx = x.^5+6*x.*y-3*y;
dy = -8*x+sin(2*x.*y);
r = ( dx.^2 + dy.^2 ).^0.5;
px = dx./r;
py = dy./r;
quiver(x,y,px,py);
Output:
For reprinting, please send an email to 1244347461@qq.com for approval. After obtaining the author's consent, kindly include the source as a link.
Related Articles
Commenting multiple lines in MATLAB
Publish Date:2025/04/18 Views:115 Category:MATLAB
-
This tutorial discusses how to comment multiple lines of code in MATLAB using the comment block method and the MATLAB Editor. Use comment blocks in MATLAB to comment multiple lines of code To comment one or two lines of code, we can % do it
Use mean() function in Matlab to get the average value of an array
Publish Date:2025/04/18 Views:145 Category:MATLAB
-
This tutorial will discuss finding the mean or average of an array using the function in MATLAB mean() . Use the MATLAB mean() function to find the average of an array To find the mean of an array, we can use Matlab's inbuilt function mean(
Find the index of a value in an array in Matlab
Publish Date:2025/04/18 Views:189 Category:MATLAB
-
This tutorial discusses find() finding the index of a value in an array using the function in MATLAB. Use the function in MATLAB find() to find the index of a value in an array In an array, elements are placed at certain indices starting fr
Sum of array elements in MATLAB
Publish Date:2025/04/18 Views:153 Category:MATLAB
-
This tutorial will discuss the use of function in Matlab sum() to find the sum of all the elements in an array. Use the MATLAB sum() function to get the sum of array elements. To get the sum of each element in an array, we can use the built
MATLAB sorts the rows
Publish Date:2025/04/18 Views:137 Category:MATLAB
-
This tutorial will discuss the use of the function in MATLAB sortrows() to sort the rows present in a matrix. In data analysis and processing, sorting is essential as it makes the data easy to analyze and process when it is sorted. For exam
如何在 Matplotlib Pyplot 中显示网格
Publish Date:2024/02/04 Views:145 Category:Python
-
本文演示了如何在 Python Matplotlib 中在一个图上画一个网格。使用 grid()函数来绘制网格,并解释了如何改变网格颜色和线条类型。
在 Matplotlib 中的图中添加文字
Publish Date:2024/02/04 Views:181 Category:Python
-
本教程展示了我们如何使用 plt.text()方法在 Matplotlib 中为图或轴添加文字。
如何在 Matplotlib 中的多个线条之间进行填充
Publish Date:2024/02/04 Views:212 Category:Python
-
`fill_between()` 每次只能填充两条线之间的区域,但是我们可以选择一对行来填充多个线条之间的区域。
如何在 Matplotlib 中画一条任意线
Publish Date:2024/02/04 Views:168 Category:Python
-
本教程讲解了我们如何在 Matplotlib 中使用 matplotlib.pyplot.plot()、matplotlib.pyplot.vlines()、matplotlib.pyplot.hlines()方法和 matplotlib.collection.LineCollection 绘制任意线条。

