Creating a new graph in Matlab
In this tutorial, we will discuss how to figure()create a new graph using the function in MATLAB.
figure()Create a new figure
using the MATLAB function
If you want to plot data on multiple graphs, you can use figure()the function to create a new figure and plot the data there. To figure()plot multiple graphs using , you just need to define the number of the graph in this function. For example, let us plot two variables on two different graphs. Refer to the code below.
t = 1:0.01:10;
x1 = sin(2*pi*t);
x2 = sin(2*pi*t - 10);
figure(1)
plot(t,x1,'Color','r')
figure(2)
plot(t,x2,'Color','g')
Output:
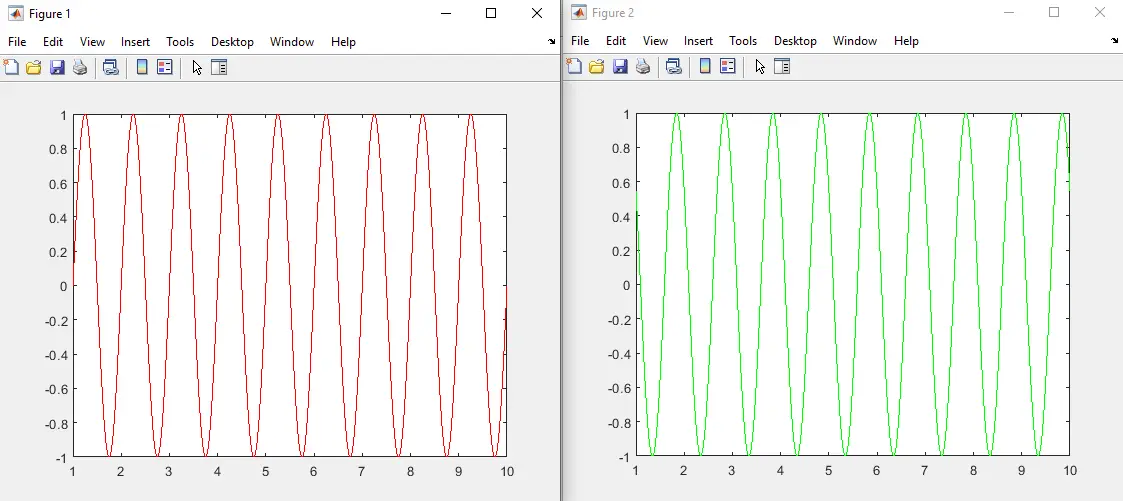
In the code above, we plotted a red sine wave in Figure 1 and a green sine wave in Figure 2. figure()Each of the functions below plot()plots the data on the same graph. If you want to plot on a new graph, you must figure()create it using the function. You can also Namename the graph using the property. You can Positionchange the position of the graph using the property, and you can Unitschange the units of the graph using the property.
For reprinting, please send an email to 1244347461@qq.com for approval. After obtaining the author's consent, kindly include the source as a link.
Related Articles
Commenting multiple lines in MATLAB
Publish Date:2025/04/18 Views:115 Category:MATLAB
-
This tutorial discusses how to comment multiple lines of code in MATLAB using the comment block method and the MATLAB Editor. Use comment blocks in MATLAB to comment multiple lines of code To comment one or two lines of code, we can % do it
Use mean() function in Matlab to get the average value of an array
Publish Date:2025/04/18 Views:145 Category:MATLAB
-
This tutorial will discuss finding the mean or average of an array using the function in MATLAB mean() . Use the MATLAB mean() function to find the average of an array To find the mean of an array, we can use Matlab's inbuilt function mean(
Find the index of a value in an array in Matlab
Publish Date:2025/04/18 Views:189 Category:MATLAB
-
This tutorial discusses find() finding the index of a value in an array using the function in MATLAB. Use the function in MATLAB find() to find the index of a value in an array In an array, elements are placed at certain indices starting fr
Sum of array elements in MATLAB
Publish Date:2025/04/18 Views:153 Category:MATLAB
-
This tutorial will discuss the use of function in Matlab sum() to find the sum of all the elements in an array. Use the MATLAB sum() function to get the sum of array elements. To get the sum of each element in an array, we can use the built
Plotting Slope Fields in MATLAB
Publish Date:2025/04/18 Views:196 Category:MATLAB
-
The ODE consists of equations involving functions and their derivatives 常微分方程 . We use 斜率 fields to illustrate the concept of our 微分 equations. We also call slope fields fields direction . Use the function in MATLAB slope_
Plotting the frequency distribution of data in MATLAB
Publish Date:2025/04/18 Views:140 Category:MATLAB
-
We will study different ways to plot frequency distribution curve of data in MATLAB. We will use different sample codes and relevant outputs to clear your concepts and provide you complete insights using MATLAB. Note that MATLAB allows user
MATLAB sorts the rows
Publish Date:2025/04/18 Views:137 Category:MATLAB
-
This tutorial will discuss the use of the function in MATLAB sortrows() to sort the rows present in a matrix. In data analysis and processing, sorting is essential as it makes the data easy to analyze and process when it is sorted. For exam
如何在 Matplotlib Pyplot 中显示网格
Publish Date:2024/02/04 Views:145 Category:Python
-
本文演示了如何在 Python Matplotlib 中在一个图上画一个网格。使用 grid()函数来绘制网格,并解释了如何改变网格颜色和线条类型。
在 Matplotlib 中的图中添加文字
Publish Date:2024/02/04 Views:181 Category:Python
-
本教程展示了我们如何使用 plt.text()方法在 Matplotlib 中为图或轴添加文字。

