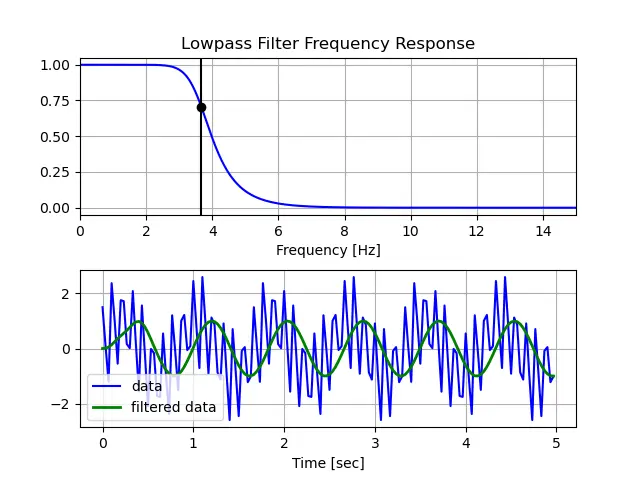
在 Python 中实现低通滤波器
低通滤波器是信号处理基础中的一个术语,经常用于过滤信号以获得更准确的结果。
本教程将讨论低通滤波器以及如何在 Python 中创建和实现它。
低通滤波器用于使频率低于截止频率的信号通过,该频率保持用户指定的某个值。所有频率超过截止频率的信号都被削弱。
在 Python 中使用 Scipy 创建低通巴特沃斯滤波器
在 Python 中,我们可以利用 SciPy 库中的函数来创建低通滤波器。SciPy 是 Scientific Python 的缩写,是一个用于提供执行信号处理、优化和统计的函数的库。该库还使用下面的 NumPy 库。
现实世界中存在几个低通滤波器。但是,我们将在 Python 中创建一个 Butterworth 低通滤波器,因为它具有最大平坦的频率,这意味着通带中没有波纹。这使其成为最流行和最常用的低通滤波器之一。
要在 Python 中成功实现此方法,我们首先需要将 NumPy、SciPy 和 Matplotlib 模块导入 Python 代码。
以下代码使用 SciPy 模块在 Python 中创建低通巴特沃斯滤波器。
import numpy as np
from scipy.signal import butter, lfilter, freqz
import matplotlib.pyplot as plt


def butter_lowpass(cutoff, fs, order=5):
    nyq = 0.5 * fs
    normal_cutoff = cutoff / nyq
    b, a = butter(order, normal_cutoff, btype="low", analog=False)
    return b, a


def butter_lowpass_filter(data, cutoff, fs, order=5):
    b, a = butter_lowpass(cutoff, fs, order=order)
    y = lfilter(b, a, data)
    return y


# Setting standard filter requirements.
order = 6
fs = 30.0
cutoff = 3.667

b, a = butter_lowpass(cutoff, fs, order)

# Plotting the frequency response.
w, h = freqz(b, a, worN=8000)
plt.subplot(2, 1, 1)
plt.plot(0.5 * fs * w / np.pi, np.abs(h), "b")
plt.plot(cutoff, 0.5 * np.sqrt(2), "ko")
plt.axvline(cutoff, color="k")
plt.xlim(0, 0.5 * fs)
plt.title("Lowpass Filter Frequency Response")
plt.xlabel("Frequency [Hz]")
plt.grid()


# Creating the data for filteration
T = 5.0  # value taken in seconds
n = int(T * fs)  # indicates total samples
t = np.linspace(0, T, n, endpoint=False)

data = (
    np.sin(1.2 * 2 * np.pi * t)
    + 1.5 * np.cos(9 * 2 * np.pi * t)
    + 0.5 * np.sin(12.0 * 2 * np.pi * t)
)

# Filtering and plotting
y = butter_lowpass_filter(data, cutoff, fs, order)

plt.subplot(2, 1, 2)
plt.plot(t, data, "b-", label="data")
plt.plot(t, y, "g-", linewidth=2, label="filtered data")
plt.xlabel("Time [sec]")
plt.grid()
plt.legend()

plt.subplots_adjust(hspace=0.35)
plt.show()

相关文章
Pandas DataFrame DataFrame.shift() 函数
发布时间:2024/04/24 浏览次数:133 分类:Python
-
DataFrame.shift() 函数是将 DataFrame 的索引按指定的周期数进行移位。
Python pandas.pivot_table() 函数
发布时间:2024/04/24 浏览次数:82 分类:Python
-
Python Pandas pivot_table()函数通过对数据进行汇总,避免了数据的重复。
Pandas read_csv()函数
发布时间:2024/04/24 浏览次数:254 分类:Python
-
Pandas read_csv()函数将指定的逗号分隔值(csv)文件读取到 DataFrame 中。
Pandas 多列合并
发布时间:2024/04/24 浏览次数:628 分类:Python
-
本教程介绍了如何在 Pandas 中使用 DataFrame.merge()方法合并两个 DataFrames。
Pandas loc vs iloc
发布时间:2024/04/24 浏览次数:837 分类:Python
-
本教程介绍了如何使用 Python 中的 loc 和 iloc 从 Pandas DataFrame 中过滤数据。
在 Python 中将 Pandas 系列的日期时间转换为字符串
发布时间:2024/04/24 浏览次数:894 分类:Python
-
了解如何在 Python 中将 Pandas 系列日期时间转换为字符串

