在 Python 中绘制水平线
我们将介绍如何在Python中创建一条水平线。 我们还将介绍 Python 中的 Matplotlib 库。
Python 中的水平线
水平线是从左到右或从右到左的任何直线。 当我们在坐标平面中看到它时,它是一条平行于 x 轴的线。
在 Python 中,Matplotlib 广泛用于绘图。 有多种方法可以绘制水平线,如下所示。
-
通过
plot()函数绘制水平线。 -
通过
hlines()函数绘制水平线。 -
通过
axhline()函数绘制水平线。
在Python中使用plot()函数
当我们的目标是生成 2D 绘图时,我们可以使用 Plot() 函数。 X 点是朝向绘图的 x 轴点,Y 点是 y 轴点。
代码:
# python
import matplotlib.pyplot as plotLine

xAxis = [3, 5, 7, 9]
yAxis = [0, 0, 0, 0]
plotLine.plot(xAxis,yAxis)
plotLine.show()
输出:
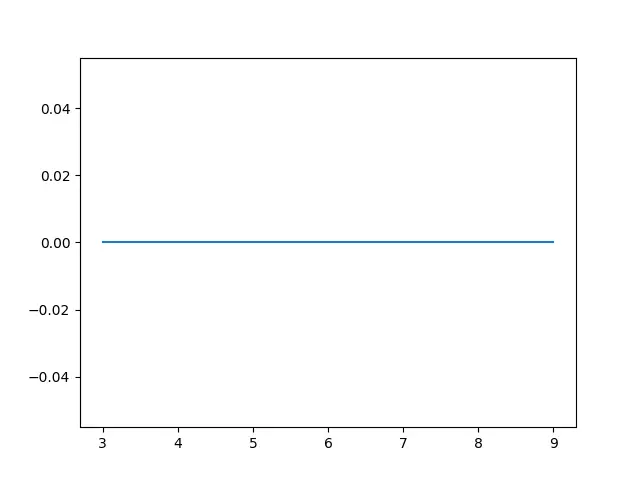
首先,我们导入了 matplotlib.pyplot 库,然后概述了我们想要绘制的数据点。 在本例中,我们将 y 轴点设置为 0,因为我们的目标是绘制一条水平线。
我们应用 plotLine.plot() 函数来绘制一条线,出于视觉目的,我们使用了 plotLine.show()。
在 Python 中使用 hlines() 函数
当我们想要绘制一条穿过轴的水平线时,我们使用 hlines() 函数。 这个函数将简化我们的任务。
语法:
# python
hlines(Yaxis, XaxisStart, XaxisEnd, lineColor, lineStyle)
这里使用了四个参数,Yaxis 表示当我们需要绘制一条线时在 y 轴上的位置。 XaxisStart 和 XaxisEnd 指示线的开始位置和结束位置。
lineColor 将为线条添加所需的颜色,lineStyle 将添加我们指定的线条的样式或类型。
代码:
# python
import matplotlib.pyplot as plotLine

plotLine.hlines(3, 5, 10, color='blue')
plotLine.show()
输出:
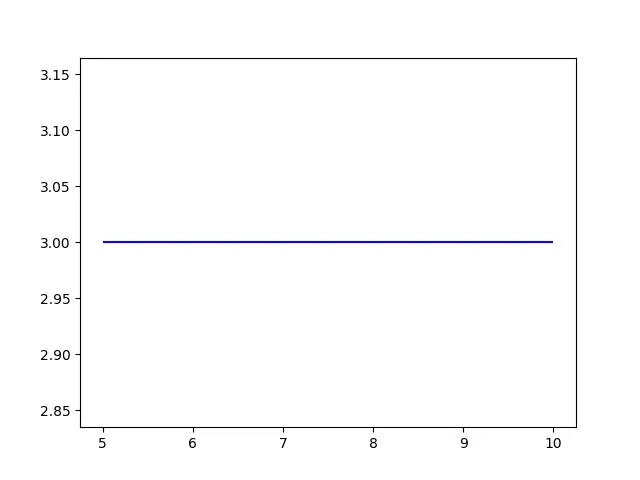
我们使用 matplotlib.pyplot 库在 hlines() 函数的帮助下创建水平线。 作为参数,我们传递了值并得到了如上所示的结果。
在 Python 中使用 axhline() 函数
axhline() 函数旨在在绘图上绘制水平线。 axhline() 函数具有与 hlines() 函数类似的参数。
代码:
# python
import matplotlib.pyplot as plotLine

plotLine.axhline(y=1.3, xmin=0.2, xmax=0.7)
plotLine.show()
输出:
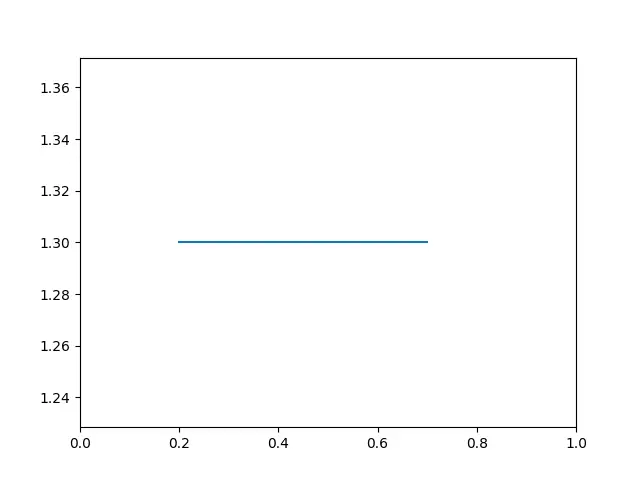
我们画了一条水平线,授权y、xmin、xmax为参数,固定为1.3、0.2、0.7。
Python 中的水平虚线
Matplotlib 库还允许我们绘制虚线。 当我们需要一条水平虚线时,我们必须将线条样式更改为虚线,这样就可以满足我们的需要。
Matplotlib.pyplot 库提供了 linestyle 参数来设置线类型。
代码:
# python
import matplotlib.pyplot as plotLine

plotLine.axhline(y=1.3, xmin=0.2, xmax=0.7, linestyle='dotted')
plotLine.show()
输出:
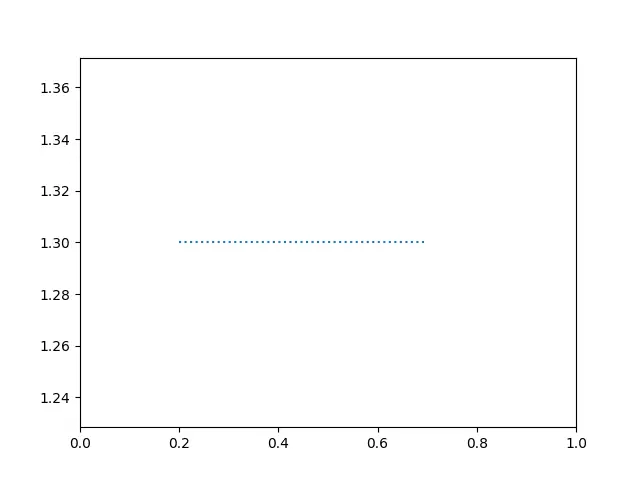
axhline() 函数有四个参数 y、xmin、xmax 和 linestyle。 我们的目标是实现水平线的点线风格,所以我们将linestyle固定为点线。
Python 中带标签的水平线
我们还可以借助 axhline() 函数实现带有标签的水平线。 我们必须将标签设置为参数。
代码:
# python
import matplotlib.pyplot as plotLine

plotLine.axhline(y=1.3, xmin=0.2, xmax=0.7, label= 'Line Label')
plotLine.legend(loc='upper left')
plotLine.show()
输出:
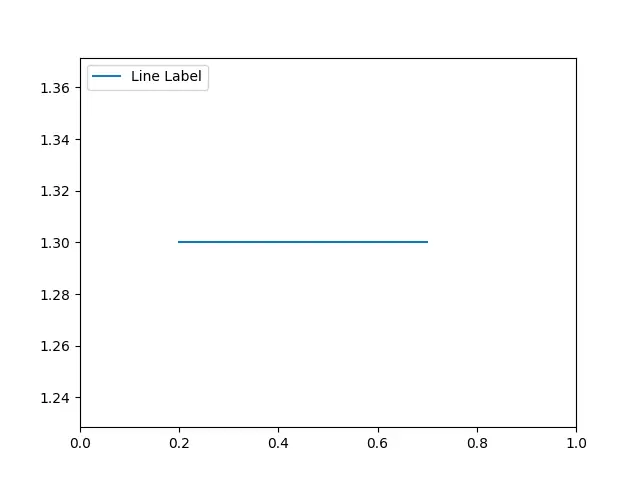
我们可以使用 label 参数轻松地为水平线创建标签。 我们可以使用另一个函数 legend() 来定义标签的位置。
多条水平线 Matplotlib
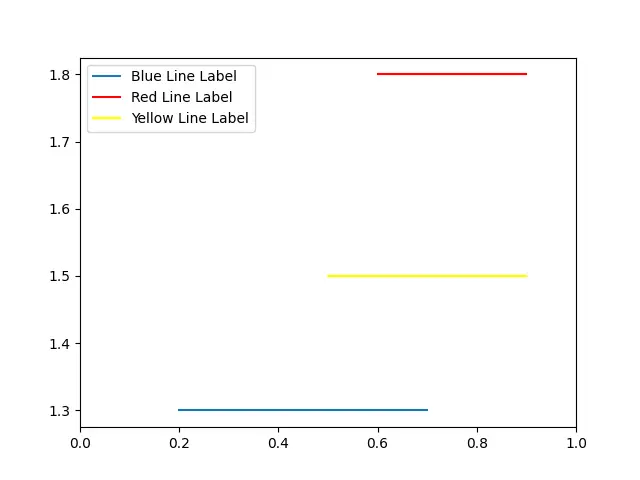
我们还可以在Python中的matplotlib中实现多条水平线。 有两种方法可以实现我们的目标:使用 axhline() 方法或使用 hlines() 方法。
Axhline() 方法允许我们在图中获得多条水平线。
代码:
# python
import matplotlib.pyplot as plotLine

plotLine.axhline(y=1.3, xmin=0.2, xmax=0.7, label= 'Blue Line Label')
plotLine.legend(loc='upper left')
plotLine.axhline(y=1.8, xmin=0.6, xmax=0.9, label= 'Red Line Label', color="red")
plotLine.legend(loc='upper left')
plotLine.axhline(y=1.5, xmin=0.5, xmax=0.9, label= 'Yellow Line Label', color="yellow")
plotLine.legend(loc='upper left')
plotLine.show()
输出:
相关文章
Pandas DataFrame DataFrame.shift() 函数
发布时间:2024/04/24 浏览次数:133 分类:Python
-
DataFrame.shift() 函数是将 DataFrame 的索引按指定的周期数进行移位。
Python pandas.pivot_table() 函数
发布时间:2024/04/24 浏览次数:82 分类:Python
-
Python Pandas pivot_table()函数通过对数据进行汇总,避免了数据的重复。
Pandas read_csv()函数
发布时间:2024/04/24 浏览次数:254 分类:Python
-
Pandas read_csv()函数将指定的逗号分隔值(csv)文件读取到 DataFrame 中。
Pandas 多列合并
发布时间:2024/04/24 浏览次数:628 分类:Python
-
本教程介绍了如何在 Pandas 中使用 DataFrame.merge()方法合并两个 DataFrames。
Pandas loc vs iloc
发布时间:2024/04/24 浏览次数:837 分类:Python
-
本教程介绍了如何使用 Python 中的 loc 和 iloc 从 Pandas DataFrame 中过滤数据。
在 Python 中将 Pandas 系列的日期时间转换为字符串
发布时间:2024/04/24 浏览次数:894 分类:Python
-
了解如何在 Python 中将 Pandas 系列日期时间转换为字符串

