逐行分析 Python 代码
本文介绍了如何逐行分析 Python 代码并获取有关代码执行的有用信息。
首先,我们简单介绍一下profiling; 然后,我们将讨论何时使用逐行分析比使用函数基础分析更好。 之后,我们将讨论 Python 中的分析实现。
什么是分析
分析是检查代码不同部分所使用的资源的过程。 对于高效的编码实践,我们通常最关心时间复杂度(不同编码单元/函数所花费的时间)或内存复杂度(不同编码单元/函数的内存利用率)。
前者帮助我们专注于减少程序占用的时间,后者帮助我们优化内存使用。
函数分析
主要在任何语言中,函数级分析用于找出程序的不同函数所消耗的时间。 因此,Python 默认包已经包含用于函数分析的库 cProfile 和 Profile。
线路轮廓仪
基于函数的分析器提供有关不同函数所花费时间的信息。 然而,我们有时需要基于行的时间复杂度来检查哪一行对函数或程序所花费的总时间贡献更大。
对于这种情况,我们有 Python 中的 line_profiler 库。
使用 line_profiler 模块分析 Python 代码
LineProfiler 模块允许我们逐行或按函数分析代码。
在下面的 Python 代码片段中,我们创建了两个名为 Slow_avg_ Producer() 和 fast_average_ Producer() 的函数。 这两个函数产生相同的平均值,但它们的执行时间不同。
首先,安装以下模块以使用线路分析器分析代码。
!pip install line_profiler
````python import time import random
def slow_avg_producer(): time.sleep(6) # Do nothing for 5 time units # generate random numbers array arr = [random.randint(1,100) for i in range(10000)] # generate random numbers array return sum(arr) / len(arr)
def fast_average_producer(): time.sleep(1) # Do nothing for 1 time units # generate random numbers array arr = [random.randint(1,100) for i in range(10000)] return sum(arr) / len(arr)
def main_func(): average = slow_avg_producer() print(average)
result = fast_average_producer()
print(average)
为了获取时序统计信息,我们首先创建 LineProfiler 对象,然后通过它传递 `main_func()` 来获取包装器。 最后,我们可以获得分析统计数据。
```python
from line_profiler import LineProfiler
line_prof = LineProfiler()
line_prof_wrapper = line_prof(main_func)
line_prof_wrapper()
# print the profiling details
line_prof.print_stats()
上面的代码产生以下输出。 时间单位为微秒。
Timer unit: 1e-06 s

Total time: 7.10521 s
File: <ipython-input-14-67ae2a9633ee>
Function: main_func at line 17

Line #      Hits         Time  Per Hit   % Time  Line Contents
==============================================================
    17                                           def main_func():
    18         1    6054801.0 6054801.0     85.2      average = slow_avg_producer()
    19         1        676.0    676.0      0.0      print(average)
    20
    21         1    1049070.0 1049070.0     14.8      result = fast_average_producer()
    22         1        659.0    659.0      0.0      print(average)
统计显示,main函数中,slow_avg_producer()耗时6.054秒,下一条打印语句耗时0.000676秒。 另一方面,fast_average_producer() 花费的时间非常少。
通过命令行分析 Python 代码
我们可以使用命令行界面来获取函数的逐行分析详细信息。 对于此方法,我们使用 kernprof 命令。
我们也将在这里使用相同的函数,只是我们将在每个函数的开头添加一个装饰器@profile。 我们将此脚本命名为average_ Producer.py。
import time
import random

@profile
def slow_avg_producer():
    time.sleep(6)  # Do nothing for 5 time units
    # generate random numbers array
    arr = [random.randint(1,100) for i in range(10000)] # generate random numbers array
    return sum(arr) / len(arr)

@profile
def fast_average_producer():
    time.sleep(1) # Do nothing for 1 time units
    # generate random numbers array
    arr = [random.randint(1,100) for i in range(10000)]
    return sum(arr) / len(arr)

@profile
def main_func():
    average = slow_avg_producer()
    print(average)

    result = fast_average_producer()
    print(average)
main_func()
使用 kernprof 命令,我们需要使用以下命令安装 line-profiler 模块。
pip install line-profiler
对于 Colab 或 Jupyter Notebook 终端,请在上述命令的开头使用感叹号 (!)。
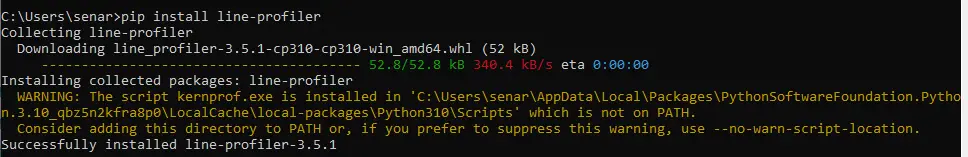
安装后,必须更改 kernprof.exe 的安装目录。 然后运行以下命令。
kernprof 为我们提供了执行 cProfile 的选项,但我们在这里使用行分析器。 为此,使用 -l 参数。
kernprof -l average_producer.py

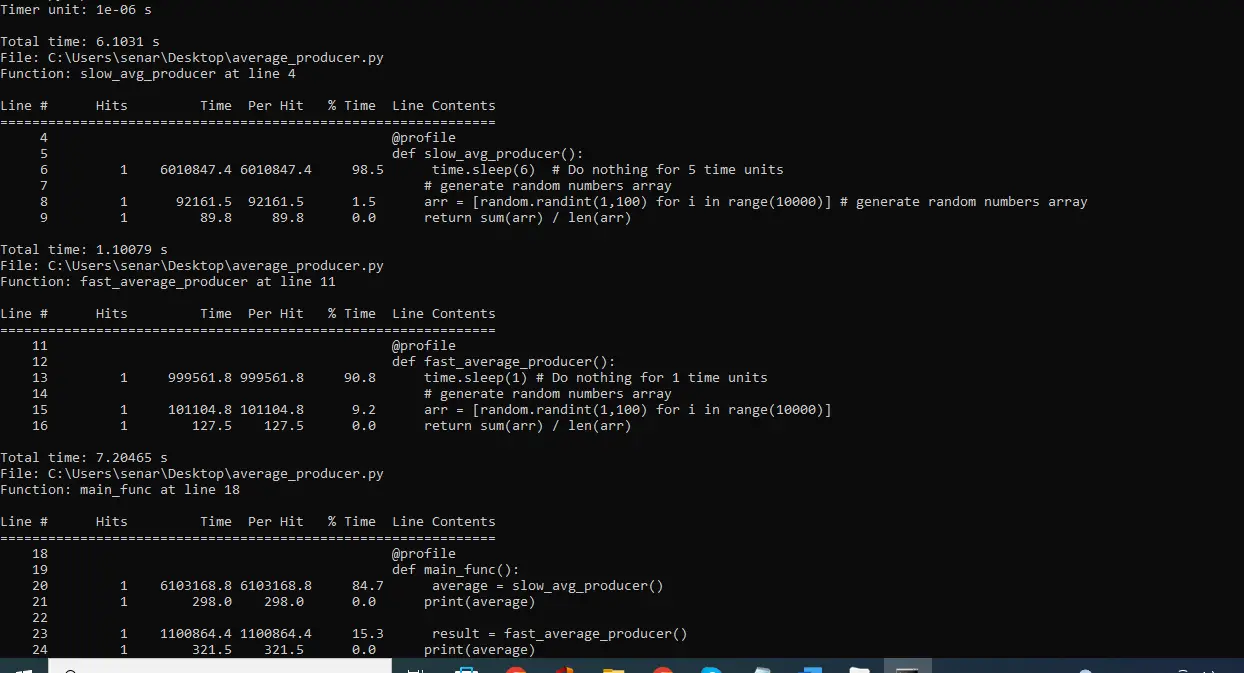
执行以下命令查看分析结果。
python -m line_profileraverage_producer.py.lprof
它在命令行界面上打印分析结果,如下所示。

相关文章
Pandas DataFrame DataFrame.shift() 函数
发布时间:2024/04/24 浏览次数:133 分类:Python
-
DataFrame.shift() 函数是将 DataFrame 的索引按指定的周期数进行移位。
Python pandas.pivot_table() 函数
发布时间:2024/04/24 浏览次数:82 分类:Python
-
Python Pandas pivot_table()函数通过对数据进行汇总,避免了数据的重复。
Pandas read_csv()函数
发布时间:2024/04/24 浏览次数:254 分类:Python
-
Pandas read_csv()函数将指定的逗号分隔值(csv)文件读取到 DataFrame 中。
Pandas 多列合并
发布时间:2024/04/24 浏览次数:628 分类:Python
-
本教程介绍了如何在 Pandas 中使用 DataFrame.merge()方法合并两个 DataFrames。
Pandas loc vs iloc
发布时间:2024/04/24 浏览次数:837 分类:Python
-
本教程介绍了如何使用 Python 中的 loc 和 iloc 从 Pandas DataFrame 中过滤数据。
在 Python 中将 Pandas 系列的日期时间转换为字符串
发布时间:2024/04/24 浏览次数:894 分类:Python
-
了解如何在 Python 中将 Pandas 系列日期时间转换为字符串

