Matplotlib 中的 twinx 和 twiny
本篇文章介绍了我们如何在 Python Matplotlib 中使用 matplotlib.axes.Axes.twinx() 和 matplotlib.axes.Axes.twiny() 创建具有共同 X 轴或 Y 轴的双轴。
在 Python Matplotlib 中使用 matplotlib.axes.Axes.twinx()
函数 matplotlib.axes.Axes.twinx() 在 Matplotlib 图中创建与初始轴共享 X 轴的其他轴。
import matplotlib.pyplot as plt

students=["Anil","Sohit","Hrishav","Ayush","Sunil"]
heights_in_cms=[165,160,140,150,130]

fig,axes=plt.subplots()
fig.set_size_inches(8, 6)
axes.bar(students,heights_in_cms)
y1, y2 = axes.get_ylim()
axes.set_xlabel("Students",fontsize=12)
axes.set_ylabel("Height in cms",fontsize=12)

twin_axes=axes.twinx()
twin_axes.set_ylim(y1*0.394,y2*0.394)
twin_axes.set_ylabel("Height in Inches",fontsize=12)

fig.suptitle("Plot using matplotlib.axes.Axes.twinx()",fontsize=15)
plt.show()
输出:

它创建了一个学生身高的条形图。左边的 Y 轴标签代表学生的身高,单位是 cm,右边的 Y 轴标签代表学生的身高,单位是 inches。
在这种情况下,我们创建一个新的轴 twin_axes,与 axes 共享 X 轴。axes 的 Y 轴的标签设置为 Height in cms,而 twin_axes 的 Y 轴设置为 Height in Inches。
Matplotlib Python 中的 matplotlib.axes.Axes.twiny()
函数 matplotlib.axes.Axes.twiny() 在 Matplotlib 图中创建与初始轴共享 Y 轴的其他轴。
import matplotlib.pyplot as plt

distance_in_kms=[10,20,30,40,50]
fare_in_dollars=[2,3.5,5,7,10]

fig,axes=plt.subplots()
fig.set_size_inches(10, 8)
axes.plot(distance_in_kms,fare_in_dollars)
x1, x2 = axes.get_xlim()
axes.set_xlabel("Distance in kms",fontsize=12)
axes.set_ylabel("Fare ($)",fontsize=12)

twin_axes=axes.twiny()
twin_axes.set_xlim(x1*0.62,x2*0.62)
twin_axes.set_xlabel("Distance in miles",fontsize=12)

fig.suptitle("Plot using matplotlib.axes.Axes.twiny()",fontsize=15)
plt.show()
输出:

我们创建一个新的轴 twin_axes,与 axes 共享 Y 轴。axes 的 X 轴的标签设置为 Distance in kms,而 twin_axes 的 X 轴设置为 Distance in miles。
Matplotlib 中一起使用 twinx() 和 twiny()
import matplotlib.pyplot as plt

distance_in_kms=[10,20,30,40,50]
fare_in_dollars=[2,3.5,5,7,10]

fig,axes=plt.subplots()
fig.set_size_inches(10, 8)
axes.plot(distance_in_kms,fare_in_dollars)
x1, x2 = axes.get_xlim()
y1, y2 = axes.get_ylim()
axes.set_xlabel("Distance in kms",fontsize=12)
axes.set_ylabel("Fare ($)",fontsize=12)

twin_axes=axes.twinx().twiny()

twin_axes.set_ylim(y1*0.85,y2*0.85)
twin_axes.set_ylabel("Fare in Euros",fontsize=12)

twin_axes.set_xlim(x1*0.62,x2*0.62)
twin_axes.set_xlabel("Distance in miles",fontsize=12)

fig.suptitle("Matplotlib use twinx() and twiny() together",fontsize=15)
plt.show()
输出:
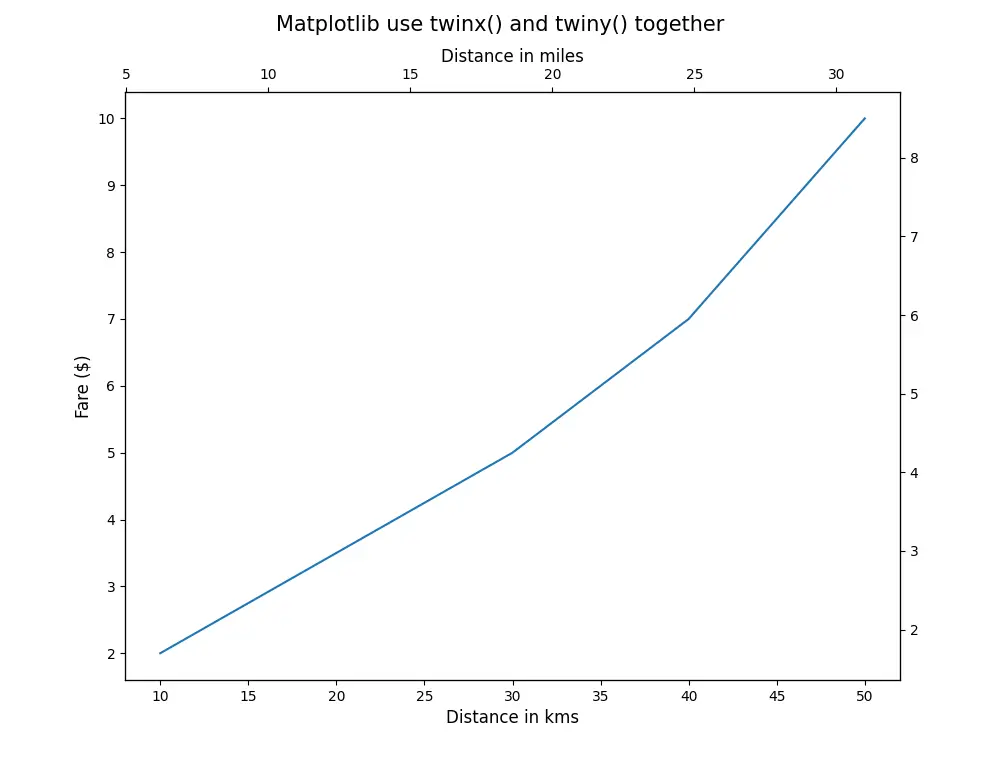
它创建一个 Matplotlib 图,图的四边都有刻度线。axes'将控制左边的 X 轴和底部的 Y 轴,而 twin_axes’将控制右边的 X 轴和顶部的 Y 轴。
相关文章
Pandas DataFrame DataFrame.shift() 函数
发布时间:2024/04/24 浏览次数:133 分类:Python
-
DataFrame.shift() 函数是将 DataFrame 的索引按指定的周期数进行移位。
Python pandas.pivot_table() 函数
发布时间:2024/04/24 浏览次数:82 分类:Python
-
Python Pandas pivot_table()函数通过对数据进行汇总,避免了数据的重复。
Pandas read_csv()函数
发布时间:2024/04/24 浏览次数:254 分类:Python
-
Pandas read_csv()函数将指定的逗号分隔值(csv)文件读取到 DataFrame 中。
Pandas 多列合并
发布时间:2024/04/24 浏览次数:628 分类:Python
-
本教程介绍了如何在 Pandas 中使用 DataFrame.merge()方法合并两个 DataFrames。
Pandas loc vs iloc
发布时间:2024/04/24 浏览次数:837 分类:Python
-
本教程介绍了如何使用 Python 中的 loc 和 iloc 从 Pandas DataFrame 中过滤数据。
在 Python 中将 Pandas 系列的日期时间转换为字符串
发布时间:2024/04/24 浏览次数:894 分类:Python
-
了解如何在 Python 中将 Pandas 系列日期时间转换为字符串

