在 Python Matplotlib 中添加趋势线
本篇文章将讨论在 Matplotlib 中向绘图添加趋势线。
在 Matplotlib 中生成要绘制的数据
在使用绘图之前,我们需要设置我们的脚本以使用该库。我们首先导入 Matplotlib。
我们从 random 模块加载 randrange 函数以快速生成一些数据。因此,请记住,这对你来说会有所不同。
import numpy
from matplotlib import pyplot as plt

x = [x for x in range(0, 10)]
y = numpy.random.rand(10)
在 Python Matplotlib 中使用 NumPy 添加趋势线
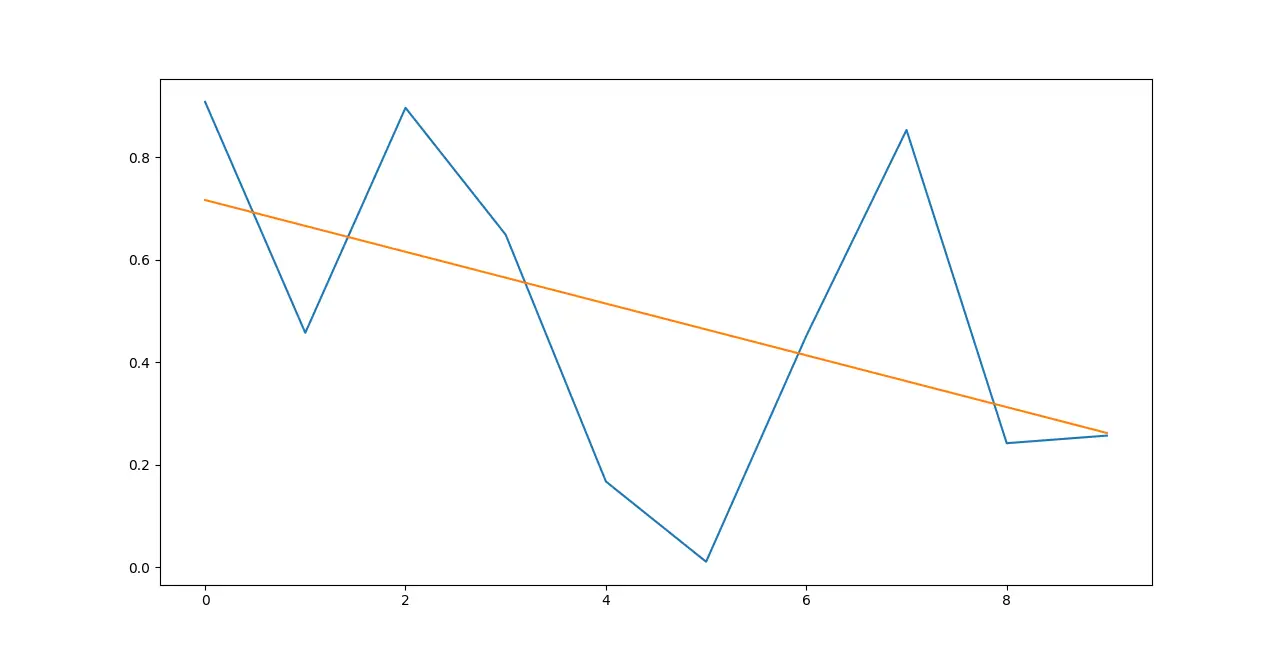
趋势线显示数据是增加还是减少。例如,地球上的整体温度可能看起来在波动,但它们正在上升。
我们用 NumPy 计算趋势线。为此,我们需要 x 轴和 y 轴。
然后我们使用 NumPy 的 polyfit 和 poly1d 函数。最后,我们绘制趋势线。
# Plot the Data itself.
plt.plot(x, y)

# Calculate the Trendline
z = numpy.polyfit(x, y, 1)
p = numpy.poly1d(z)

# Display the Trendline
plt.plot(x, p(x))
输出:
完整代码
import numpy
from matplotlib import pyplot as plt

x = [x for x in range(0, 10)]
y = numpy.random.rand(10)

# Plot the Data itself.
plt.plot(x, y)

# Calculate the Trendline
z = numpy.polyfit(x, y, 1)
p = numpy.poly1d(z)

# Display the Trendline
plt.plot(x, p(x))

plt.show()
相关文章
Pandas DataFrame DataFrame.shift() 函数
发布时间:2024/04/24 浏览次数:133 分类:Python
-
DataFrame.shift() 函数是将 DataFrame 的索引按指定的周期数进行移位。
Python pandas.pivot_table() 函数
发布时间:2024/04/24 浏览次数:82 分类:Python
-
Python Pandas pivot_table()函数通过对数据进行汇总,避免了数据的重复。
Pandas read_csv()函数
发布时间:2024/04/24 浏览次数:254 分类:Python
-
Pandas read_csv()函数将指定的逗号分隔值(csv)文件读取到 DataFrame 中。
Pandas 多列合并
发布时间:2024/04/24 浏览次数:628 分类:Python
-
本教程介绍了如何在 Pandas 中使用 DataFrame.merge()方法合并两个 DataFrames。
Pandas loc vs iloc
发布时间:2024/04/24 浏览次数:837 分类:Python
-
本教程介绍了如何使用 Python 中的 loc 和 iloc 从 Pandas DataFrame 中过滤数据。
在 Python 中将 Pandas 系列的日期时间转换为字符串
发布时间:2024/04/24 浏览次数:894 分类:Python
-
了解如何在 Python 中将 Pandas 系列日期时间转换为字符串

