Matplotlib 中的坐标轴标题
在本教程中,我们将学习 Matplotlib 中的坐标轴标题。
Matplotlib 坐标轴标题
matplotlib.pyplot.title(label, fontdict=None, loc=None, **kwargs)
它用来设置当前轴的标题。
参数
| 名称 | 数据类型 | 描述 |
|---|---|---|
label |
str |
标签文字 |
fontdict |
dict |
标签文字字体字典,例如字体系列、颜色、粗细和大小 |
loc |
str |
标题的位置。它具有三个选项,{'center', 'left', 'right'}。默认选项是 center |
# -*- coding: utf-8 -*-
import numpy as np
import matplotlib.pyplot as plt
x = np.linspace(0, 4 * np.pi, 1000)
y = np.sin(x)
plt.figure(figsize=(4, 3))
plt.plot(x, y, "r")
plt.xlabel("Time (s)", size = 16,)
plt.ylabel("Value", size = 16)
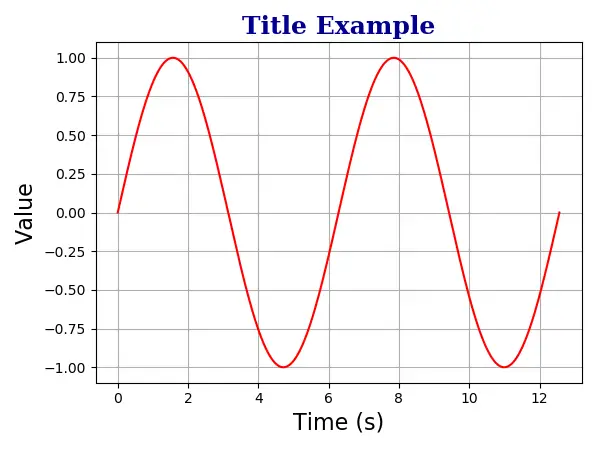
plt.title("Title Example",
fontdict={'family': 'serif',
'color' : 'darkblue',
'weight': 'bold',
'size': 18})
plt.grid(True)
plt.show()
plt.title("Title Example",
          fontdict={'family': 'serif',
                    'color' : 'darkblue',
                    'weight': 'bold',
                    'size': 18})
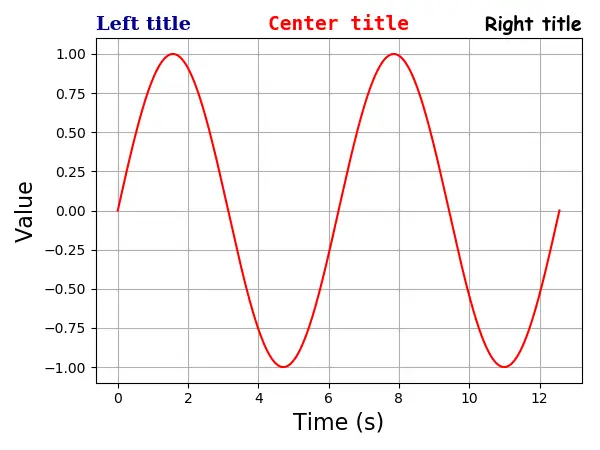
坐标轴上的多个标题
一个轴最多可以包含三个标题 left,center 和 right。特定标题的位置由 loc 参数指定。
# -*- coding: utf-8 -*-
import numpy as np
import matplotlib.pyplot as plt

x = np.linspace(0, 4 * np.pi, 1000)
y = np.sin(x)

plt.figure(figsize=(8, 6))

plt.plot(x, y, "r")
plt.xlabel("Time (s)", size = 16,)
plt.ylabel("Value", size = 16)

plt.title("Left title",
          fontdict={'family': 'serif',
                    'color' : 'darkblue',
                    'weight': 'bold',
                    'size': 16},
          loc='left')

plt.title("Center title",
          fontdict={'family': 'monospace',
                    'color' : 'red',
                    'weight': 'bold',
                    'size': 16},
          loc='center')

plt.title("Right title",
          fontdict={'family': 'fantasy',
                    'color' : 'black',
                    'weight': 'bold',
                    'size': 16},
          loc='right')

plt.grid(True)

plt.show()
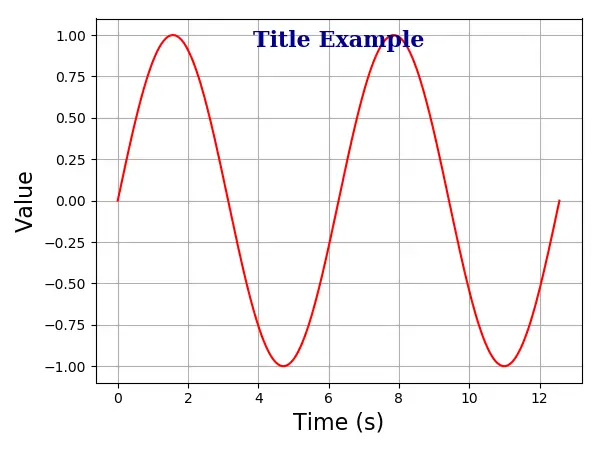
将坐标轴标题放置在绘图内部
你还可以使用 positon=(m, n) 或等效选项 x = m, y = n 将标题放置在绘图内。在这里,m 和 n 是介于 0.0 和 1.0 之间的数字。
位置 (0, 0) 是图的左下角,位置 (1.0, 1.0) 是右上角。
# -*- coding: utf-8 -*-
import numpy as np
import matplotlib.pyplot as plt

x = np.linspace(0, 4 * np.pi, 1000)
y = np.sin(x)

plt.figure(figsize=(6, 4.5))

plt.plot(x, y, "r")
plt.xlabel("Time (s)", size = 16)
plt.ylabel("Value", size = 16)

plt.title("Title Example",
          position=(0.5, 0.9),
          fontdict={'family': 'serif',
                    'color' : 'darkblue',
                    'weight': 'bold',
                    'size': 16})

plt.show()
相关文章
Pandas DataFrame DataFrame.shift() 函数
发布时间:2024/04/24 浏览次数:133 分类:Python
-
DataFrame.shift() 函数是将 DataFrame 的索引按指定的周期数进行移位。
Python pandas.pivot_table() 函数
发布时间:2024/04/24 浏览次数:82 分类:Python
-
Python Pandas pivot_table()函数通过对数据进行汇总,避免了数据的重复。
Pandas read_csv()函数
发布时间:2024/04/24 浏览次数:254 分类:Python
-
Pandas read_csv()函数将指定的逗号分隔值(csv)文件读取到 DataFrame 中。
Pandas 多列合并
发布时间:2024/04/24 浏览次数:628 分类:Python
-
本教程介绍了如何在 Pandas 中使用 DataFrame.merge()方法合并两个 DataFrames。
Pandas loc vs iloc
发布时间:2024/04/24 浏览次数:837 分类:Python
-
本教程介绍了如何使用 Python 中的 loc 和 iloc 从 Pandas DataFrame 中过滤数据。
在 Python 中将 Pandas 系列的日期时间转换为字符串
发布时间:2024/04/24 浏览次数:894 分类:Python
-
了解如何在 Python 中将 Pandas 系列日期时间转换为字符串

