在 Matplotlib 的图上画垂直线
在处理图表时,我们经常需要在图表上绘制水平线和垂直线来描绘一些信息。它可以是某个平均值、某个阈值或某个范围。本文将讨论如何在 Python 中使用 Matplotlib 生成的图上创建垂直线。
在 Matplotlib 中使用 axvline() 绘制垂直线
axvline() 是来自 Matplotlib 库的一个函数,它沿着轴绘制垂直线。这个函数占用了很多参数,但我们将讨论其中的三个,如下所示。
-
x: The position of the line on thex-axis -
ymin:该值应介于 0 和 1 之间,其中 0 表示图的底部,1 表示图的顶部。 -
ymax:该值应介于 0 和 1 之间,其中 0 表示图的底部,1 表示图的顶部。
其他参数包括 color、label、marker、snap、transform、url、visible 等。
请参阅以下示例以了解如何使用这个函数。
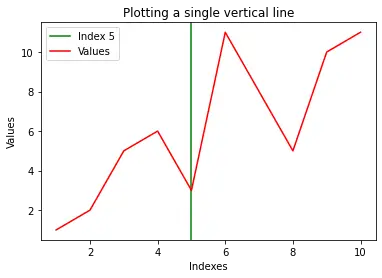
示例 1 - 绘制一条垂直线
import random
import numpy as np
import matplotlib.pyplot as plt

x = np.array([1, 2, 3, 4, 5, 6, 7, 8, 9, 10])
y = np.array([1, 2, 5, 6, 3, 11, 8, 5, 10, 11])
plt.axvline(x = 5, color = "green", label = "Index 5") # Plotting a single vertical line
plt.plot(x, y, color = "red", label = "Values")
plt.title("Plotting a single vertical line")
plt.xlabel("Indexes")
plt.ylabel("Values")
plt.legend()
plt.show()
输出:
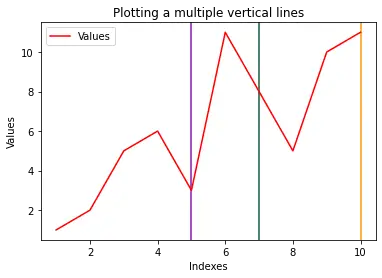
示例 2 - 绘制多条垂直线
import random
import numpy as np
import matplotlib.pyplot as plt

x = np.array([1, 2, 3, 4, 5, 6, 7, 8, 9, 10])
y = np.array([1, 2, 5, 6, 3, 11, 8, 5, 10, 11])

for i in range(3):
    plt.axvline(x = random.randint(1, 10), color = np.random.rand(3, )) # Plotting a vertical line

plt.plot(x, y, color = "red", label = "Values")
plt.title("Plotting multiple vertical lines")
plt.xlabel("Indexes")
plt.ylabel("Values")
plt.legend()
plt.show()
输出:
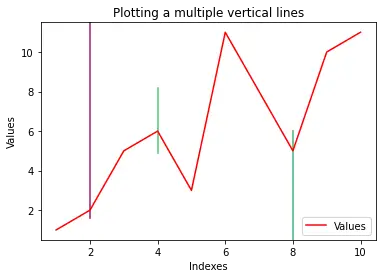
示例 3 - 具有可变长度的多条线
import random
import numpy as np
import matplotlib.pyplot as plt

x = np.array([1, 2, 3, 4, 5, 6, 7, 8, 9, 10])
y = np.array([1, 2, 5, 6, 3, 11, 8, 5, 10, 11])
yMins = [1, 0.7, 0.5]
yMaxs = [0.1, 0.4, 0]
positions = [2, 4, 8]

for i in range(3):
    plt.axvline(x = positions[i], ymin = yMins[i], ymax = yMaxs[i], color = np.random.rand(3, )) # Plotting a vertical line

plt.plot(x, y, color = "red", label = "Values")
plt.title("Plotting a multiple vertical lines")
plt.xlabel("Indexes")
plt.ylabel("Values")
plt.legend()
plt.show()
输出:
相关文章
Pandas DataFrame DataFrame.shift() 函数
发布时间:2024/04/24 浏览次数:133 分类:Python
-
DataFrame.shift() 函数是将 DataFrame 的索引按指定的周期数进行移位。
Python pandas.pivot_table() 函数
发布时间:2024/04/24 浏览次数:82 分类:Python
-
Python Pandas pivot_table()函数通过对数据进行汇总,避免了数据的重复。
Pandas read_csv()函数
发布时间:2024/04/24 浏览次数:254 分类:Python
-
Pandas read_csv()函数将指定的逗号分隔值(csv)文件读取到 DataFrame 中。
Pandas 多列合并
发布时间:2024/04/24 浏览次数:628 分类:Python
-
本教程介绍了如何在 Pandas 中使用 DataFrame.merge()方法合并两个 DataFrames。
Pandas loc vs iloc
发布时间:2024/04/24 浏览次数:837 分类:Python
-
本教程介绍了如何使用 Python 中的 loc 和 iloc 从 Pandas DataFrame 中过滤数据。
在 Python 中将 Pandas 系列的日期时间转换为字符串
发布时间:2024/04/24 浏览次数:894 分类:Python
-
了解如何在 Python 中将 Pandas 系列日期时间转换为字符串

